2. Figures, tables and diagrams
This chapter demonstrates the visual elements you will use most in a
specification: images, tables in two different styles, and diagrams generated
from text. As before, read the rendered page, then open chapter2.rst to see
the markup.
2.1. Figures
A figure is an image with a caption. Put your image file in the top-level
images/ folder and reference it with a relative path. The :width: option
scales it to a share of the page width.
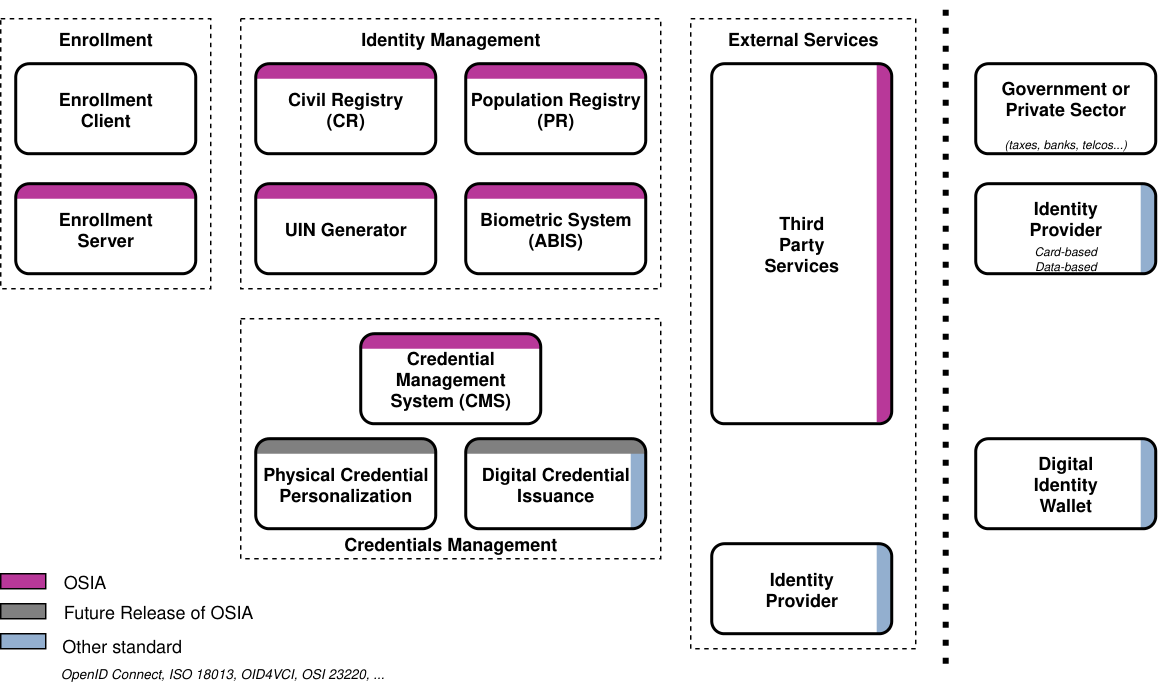
Fig. 2.1 A figure caption appears below the image and is numbered automatically.
Use a single raster image (PNG) so the same file works in both the web pages and the PDF. Vector formats (SVG) look sharper on screen but need a separate PDF copy, so PNG keeps the template simple.
2.2. Tables
Two table styles are available; pick whichever is easier for the content.
A list-table is the easiest to edit: every cell is a bullet, so you never have to align columns by hand. Add or remove rows freely.
Field |
Description |
|---|---|
id |
The unique identifier. |
name |
A human-readable name. |
A grid-style table can group rows under spanning headers, which is useful
for mapping matrices. Its one rule: the cell text MUST line up under the =
and - border characters, or the build fails with “Malformed table”. Edit it
carefully, keeping each column within its width.
Rows |
Column A |
Column B |
Column C |
|---|---|---|---|
Group One |
|||
Item One |
X |
X |
|
Item Two |
X |
X |
X |
Group Two |
|||
Item Three |
X |
X |
|
2.3. Diagrams
Diagrams are written as text and rendered to images at build time using PlantUML — so they stay editable, version-controlled, and consistent in style. This is a sequence diagram describing an interaction between three parties:
Fig. 2.2 A sequence diagram, written as text
The same .. uml:: block draws many other diagram types. A class diagram,
for example, is a convenient way to document a data model — the entities, their
fields, and the relationships between them:
Fig. 2.3 A class diagram describing a data model
PlantUML can also draw use-case diagrams, activity diagrams, state machines and more — see https://plantuml.com for the full syntax.
Note
Diagrams require PlantUML to be available at build time. The online build (GitHub Pages) installs it automatically; for local builds see the project HOWTO.